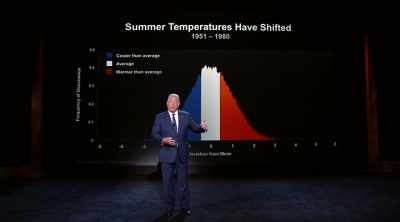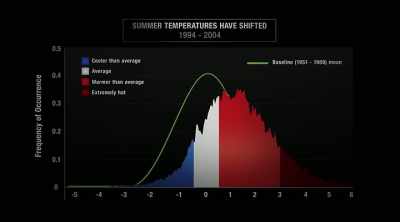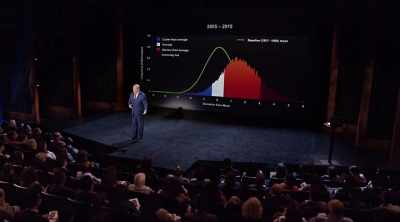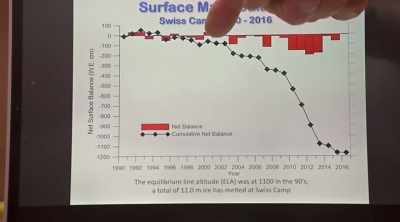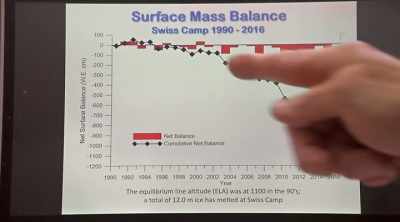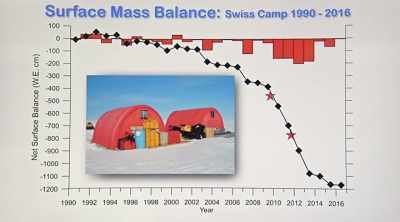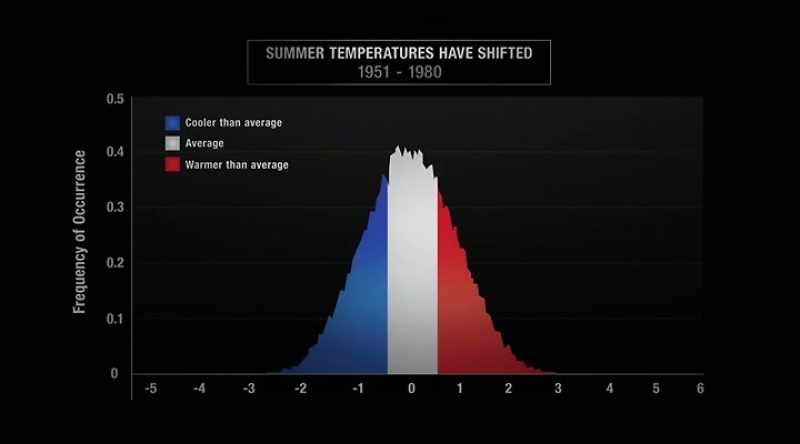

This graph showsaverage temperatures from 1951 through 1980
Join the conversation
Log in or create an account to leave a comment
Log In
This graph shows
average temperatures from 1951 through 1980
average temperatures from 1951 through 1980
Full Transcript
00:00:01.000 --> 00:00:04.102
This graph shows
average temperatures
00:00:04.137 --> 00:00:07.271
from 1951 through 1980.
Want This Clip in HD?
Upgrade for HD/4K downloads and unlimited access. Upgrade now →
Movie Summary
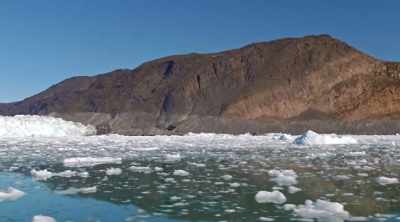
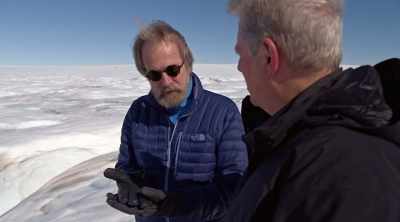
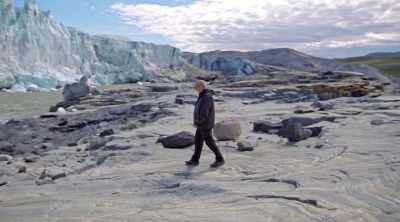
A decade after An Inconvenient Truth (2006) brought climate change to the heart of popular culture, the follow-up shows just how close we are to a real energy revolution.